Make sense of your Twitter numbers
Twitter engagement rate: why your reports don't agree
The same post can have a 2% or 5% engagement rate without gaining a single interaction. Here's how to tell what each percentage measures before deciding what to post next.
Start with the formula behind the percentage
Your Twitter report says 2% engagement. A calculator gives the same post 5%. Before changing your content strategy, check what each number divides by.
For an impression-based Twitter engagement rate, use:
Engagement rate = engagements ÷ impressions × 100
That is the definition in X's Post Activity Dashboard documentation. X counts more than public reactions as engagements: clicks to expand a post or open a profile can contribute too.
Take a fictional post with 50 engagements, 2,500 impressions, and an author with 1,000 followers. Its impression-based rate is 50 ÷ 2,500 × 100 = 2%. Divide the same engagements by followers instead and you get 50 ÷ 1,000 × 100 = 5%.
The post hasn't changed; the denominator has. Treating 5% as the better performance could send you chasing a content strategy that only looks better in a spreadsheet. All numerical examples in this guide are fictional.
Followers and impressions answer different questions
An impression-based rate measures recorded interactions relative to recorded displays of a post. A follower-based rate measures interactions relative to the size of the account's follower base.
The second figure does not tell you what percentage of your followers engaged. Some interactions may come from non-followers, and your follower count doesn't tell you how many followers saw that post.
Nor does an impression-based rate tell you the percentage of individual readers who reacted. X's metrics reference defines impressions as non-unique: the same person can contribute more than one. Interactions are actions, not a deduplicated list of people.
Save the denominator alongside the number: “2% by impressions.” For a follower-based calculation, record when the follower count was measured; using today's larger audience changes the rate of an old post even if its engagement count stays fixed.
Likes plus replies may not match total engagements
Suppose you add likes, reposts, and replies, then divide by impressions. You've calculated a rate for those three actions. Label it that way. Adding bookmarks or quotes changes the definition again.
Don't expect that sum to match a report using X's total engagements field, which can include clicks you didn't add. Conversely, adding individual actions on top of a total can double-count them.
The API also distinguishes public metrics from private metrics available for owned posts. Its documentation currently limits non-public, organic, and promoted metrics to posts created within the last 30 days. That can make the data available for an older post different from a recent one.
In PilotMyX, the engagement total comes from the field X supplies; it isn't reconstructed by adding visible reactions. If a metric is unavailable, don't substitute likes and call the result the same engagement rate. Keep any narrower calculation separate, with its own label.
Calculate the combined rate from totals
For a group of posts, add their engagements and impressions separately, then divide. Use the same set of posts with comparable metric coverage for both totals.
This fictional example shows why averaging the displayed percentages gives a different result:
| Post | Engagements | Impressions | Rate by impressions |
|---|---|---|---|
| A | 10 | 100 | 10.00% |
| B | 90 | 9,000 | 1.00% |
| Combined | 100 | 9,100 | 1.10% |
The simple average of the two post rates is (10% + 1%) ÷ 2 = 5.5%. That gives each post equal weight, despite B having 90 times as many impressions.
The combined rate is 100 ÷ 9,100 × 100, or about 1.10%. This answers how many engagements the group generated relative to its total impressions. PilotMyX's period summary uses this totals-based calculation.
The simple average describes your equally weighted posts; the combined rate weights them by impressions. Post A had the higher rate, but B generated nine times as many engagements. Which one you repeat depends on what you wanted that post to do.
A higher rate isn't automatically a better business result
If your goal is visitors to your product, compare URL clicks as well. A post with fewer total interactions might bring more interested visitors than one that attracts a long debate.
Keep the calculation specific: URL click rate = URL clicks ÷ impressions × 100, using matching coverage. A click still isn't a signup or a customer; use your website analytics to follow that part of the journey. The Twitter website traffic guide explains how to connect those reports.
Be equally careful with changes over time. Going from 2% to 3% is an increase of one percentage point, or 50% relative to the old rate. It doesn't mean 50% more people engaged. You need the underlying counts to know whether total engagements rose or fell.
What is a good Twitter engagement rate for your account?
Use your own comparable history as a starting point. A published benchmark is only useful if you know its numerator, denominator, sample, and time window. Without those, “above average” can be meaningless.
For your own review, keep original posts and replies separate initially. Check post ages and whether promotion was involved. A post that's been accumulating interactions for a month isn't an equal-age comparison for one published yesterday.
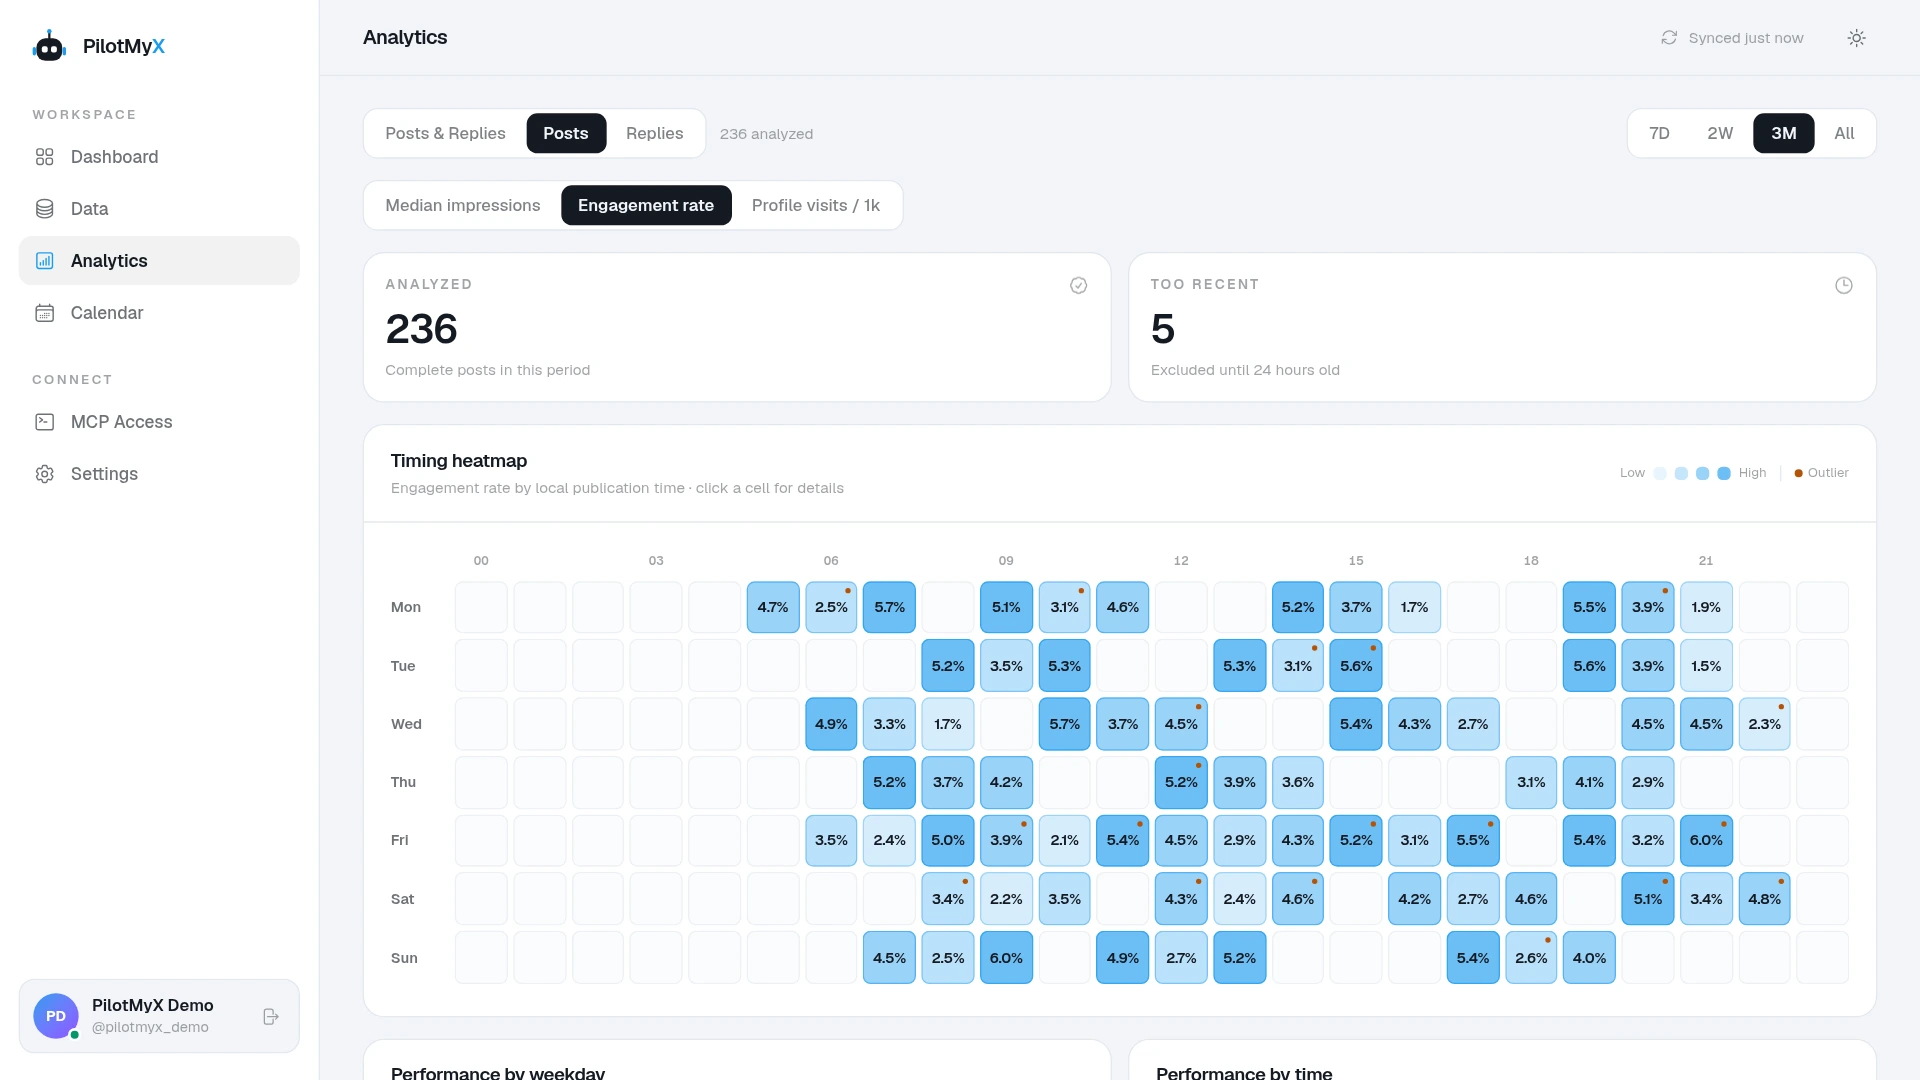
PilotMyX selects posts by their publication dates and uses their latest synchronized metrics. A September cohort therefore doesn't mean every counted interaction happened in September. The analytics methodology explains those date boundaries.
Also inspect the volume behind a surprising rate. Ten engagements from 100 impressions is a small example to base a strategy on. Zero impressions leaves the mathematical rate undefined, even if an interface displays 0%. Missing engagement data likewise can't prove that nobody interacted.
Ask your agent to explain the difference
If two numbers disagree, give your agent the reports' definitions as well as their values. With PilotMyX connected, this prompt helps you reconcile the calculation before using it to choose content:
Review my Twitter engagement rate for [start date] through [end date] in [timezone], using the data already available in PilotMyX.

Show the engagement total, impression total, post count, and freshness. Explain which actions the engagement field represents and flag unavailable data. Keep original posts and replies separate first.

Calculate the combined rate from summed engagements and impressions, expressed as a percentage. Compare it with the mean of individual post rates only where both metrics are available and impressions are positive. State any exclusions and don't silently mix the samples.

Show two posts where ranking by engagement rate gives a different order from ranking by total engagements or URL clicks, if such examples exist. Explain what each ranking helps me decide.

My goal is [website visits / conversations / another goal]. Recommend one content idea worth testing from those examples, without treating a high rate as proof of what caused the result. Keep this review read-only.
If you haven't connected an agent yet, follow the PilotMyX setup guide. Bring a post you were tempted to repeat because of its percentage. Check its actual contribution to your goal, then use what you learn to draft and schedule the next one after review.
Use your own account